Hello! This week’s ETF wrap digs into homebuilders.
Please send feedback and tips to [email protected]. You can also follow me on Twitter at @cidzelis and find me on LinkedIn.
Exchange-traded funds that invest in shares of homebuilders are outperforming the S&P 500 index so far this year.
Homebuilder stocks are up in 2023 after being “battered” in 2022, said Rene Reyna, head of product strategy for Invesco’s thematic ETFs, in a phone interview. While it’s been “a better environment than 2022” for homebuilders he said, the industry is “still not out of the woods.”
Shares of the iShares U.S. Home Construction ETF
ITB,
have soared almost 13% so far this year, after tanking almost 27% last year, according to FactSet data. And the SPDR S&P Homebuilders ETF
XHB,
has climbed more than 9% in 2023 through Thursday, while the Invesco Dynamic Building & Construction ETF
PKB,
is up almost 9% this year, FactSet data show.
Homebuilder Lennar Corp.’s first-quarter results, released March 14, beat Wall Street’s forecasts. Shares of the Miami-based company
LEN,
have climbed 7% this week, bringing their year-to-date gain to around 15%, FactSet data show.
“During the quarter, we saw a generally strong economy at the intersection of high inflation and strong employment numbers, while the housing market continued down a winding road of trying to find its footing,” Stuart Miller, Lennar’s executive chairman, said in the announcement on its results. “The Federal Reserve stayed its course of raising interest rates to cool inflation, though has yet to reach desired results.”
Construction on new U.S. homes rose 9.8% in February to 1.45 million, according to a report Thursday from the Department of Commerce. That was above forecasts from economists polled by The Wall Street Journal. Building permits for new homes jumped 13.8% to 1.52 million in February, the government data show, also more than expected.
“Housing construction showed some signs of life in February, rising for the first time in six months,” economists at First Trust said in a note Thursday.
“Multi-unit construction was the reason for most of February’s gain,” they said. “Though single-family starts did eke out an increase of 1.1%, it’s clear that 30-year mortgage rates hovering near 7% are keeping developers from investing in these types of projects.”
All eyes will be on the Fed next week as investors watch for whether it will decide at its policy meeting to continue raising interest rates to battle still high inflation amid concerns over banking sector woes.
Should the Fed pause or point to a slowing of rate hikes, that could be “positive” for homebuilders, Invesco’s Reyna said.
But recent trouble in the banking sector seen with the failure of Silicon Valley Bank and subsequent U.S. government intervention raises questions over whether bank lending will pull back, he said. He also cautioned that recession fears could lead consumers to wait before taking out a loan for a home purchase.
As for building permits, February’s “robust” rise was led by the multi-family segment of the housing market while “permits for single-family homes still remain at relatively low levels,” according to a U.S. economics research report from Barclays Thursday.
Homebuilder ETF flows
Meanwhile, capital flowing into the Invesco Dynamic Building & Construction ETF has been relatively flat this month through March 14, according to Reyna. About 40% of the fund is exposed to homebuilders, with the portfolio also holding companies in the area of materials, he said.
The iShares U.S. Home Construction ETF on March 10 saw $179 million of inflows, its largest daily inflow since October 2021, according to FactSet data. Small inflows followed this week before investors pulled $27 million from the fund on Wednesday, FactSet data show.
Investors contributed $136 million to the SPDR S&P Homebuilders ETF on Wednesday, its biggest daily inflow since late February, FactSet data show. That’s after $88 million of inflows on March 14 and $124 million of outflows on March 13.
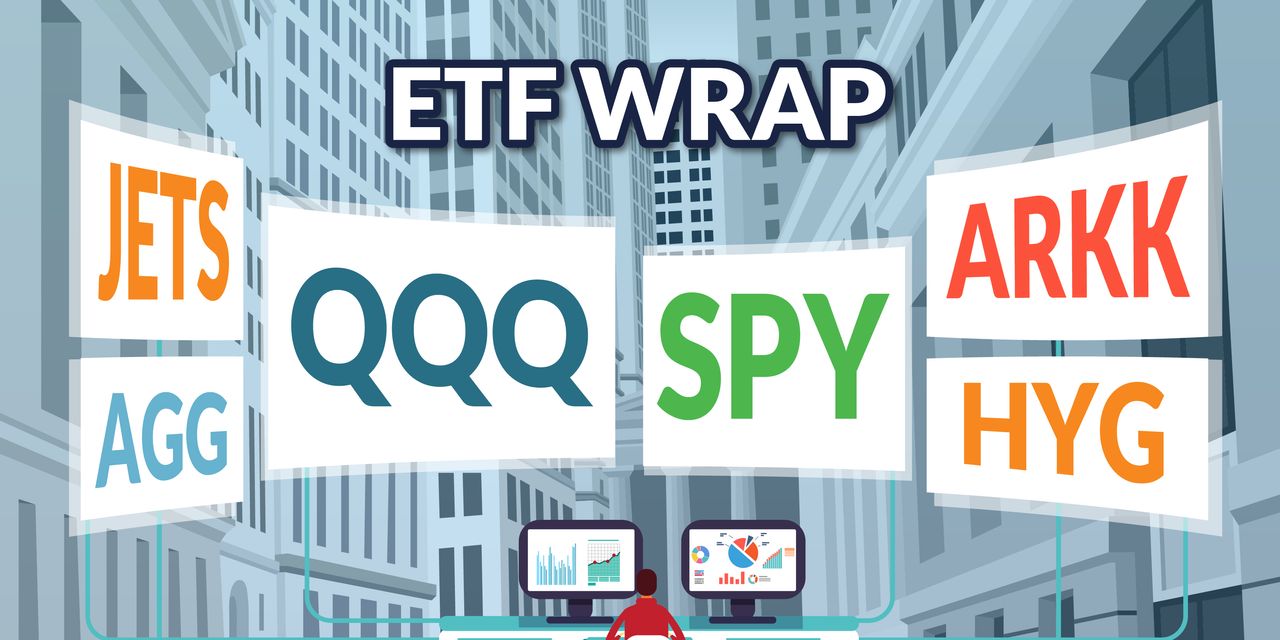
Meanwhile, the U.S. stock market finished Thursday sharply higher, with the S&P 500 closing up 1.8%, according to FactSet data. The SPDR S&P 500 ETF Trust
SPY,
has risen 3.6% this year through Thursday.
As usual, here’s your look at the top- and bottom-performing ETFs over the past week through Wednesday, according to FactSet data.
The good…
| Top Performers | %Performance |
|
Quadratic Interest Rate Volatility & Inflation Hedge ETF IVOL, |
13.0 |
|
VanEck Gold Miners ETF GDX, |
9.9 |
|
abrdn Physical Silver Shares ETF SIVR, |
8.5 |
|
iShares Silver Trust SLV, |
8.5 |
|
VanEck Junior Gold Miners ETF GDXJ, |
8.5 |
| Source: FactSet data through Wednesday, March 15 from a start date five trading days earlier. Excludes ETNs and leveraged products. Includes NYSE, Nasdaq and Cboe traded ETFs of $500 million or greater. |
…and the bad
Weekly ETF reads
Read the full article here