At O’Neil Global Advisors, in addition to fundamental research on companies, a substantial part of our process of analyzing ideas is looking at those breaking into new highs, and conversely, breaking down below key support levels.
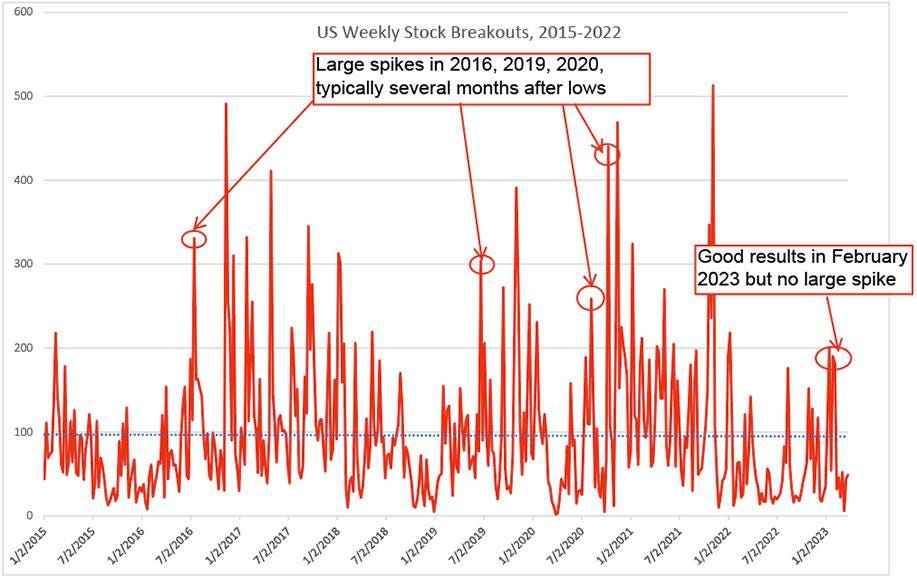
In terms of breakouts, we have talked about the need for the count to rise substantially to gain confidence in a sustained stock market uptrend (see article from February 2023). Since August 2022, there have been several short-term surges in the breakout totals. Still, a bigger surge has been present in past cycles to mark the “all clear” signal for the market. For instance, in July 2016, about five months after recent market lows, the weekly total jumped to over 300 breakouts and then followed through consistently throughout 2017. In June 2019, about six months after the market lows, the total jumped to over 300, and led to a very strong market for the next 6-8 months. In August 2020, five months after the lows, the total jumped to 260 and led to another 15+ months of upside in the market.
As seen above, most recently, in February 2023, the breakout totals rose to near 200 for two weeks, but fell short of a larger spike. Let’s now take a look at how those breakouts have acted or failed.
First, a quick description of a successful versus failed breakout and the rationale behind monitoring each.
Successful breakout:
- Breakout and close day above price pivot, or prior left side high, from a defined base/or period of consolidation.
- Continues higher and begins a new uptrend immediately, or sustains a minor pullback of less than 7% before finding support and then continuing higher.
- One recent example is Duolingo, Inc. (DUOL):
- Over the longer term, an ideal sequence is a breakout, followed by a rally (20% or more), then followed by the formation of a new base on top of the prior base. We would typically suggest taking some profits on stocks that have rallied ~20% from the pivot and waiting for a new base to form.
- A recent example is First Solar
FSLR
Failed Breakout:
- A breakout above the pivot, a failure to rally or possibly a rally but <20%, reversal lower to back within the old base, and trade to -7% to -10% or more below the pivot price (a more strict O’Neil cutoff would actually be between -5% and -7%). This “stop-loss” fail safe is a key tenet of the O’Neil strategy, but is reliant on buying “properly”. For example, if a stock is bought 10% above the pivot price, and then pulls back 10% to the pivot, this would trigger the stop-loss even though the breakout is still intact. For this reason, buying extended stocks beyond a few percentage points above the pivot is not ideal.
- A recent example of a breakdown is Morgan Stanley
MS
There is also a third category, where the breakout is in limbo. This would occur when a stock breaks out but fails to make progress and pulls back into its old base, but does not trade between -7% and -10% or more below the pivot. A recent example below is Rockwell Automation
ROK
An overview of US market breakouts since the start of 2023 shows that 650 stocks above $500M have broken out of their bases at some point. Of these, the graph below breaks down their current positioning relative to their pivot price.
Unfortunately, the results have turned sharply negative in recent weeks.
- A clear majority, 71% of stock breakouts are currently back below their pivot point.
- About 43% have clearly failed and are at least -10% or more below the pivot.
- For the best-case scenario, just 12% are at least +10% above their pivot. Another 18% are above the pivot but by less than +10%.
- The remaining (28%) are either just below the pivot, or teetering on failure between -5 and -10% below.
Below are a handful of the recent breakouts that are either approaching failure or that have already failed.
In conclusion, understanding and respecting a failed breakout is a key component of the O’Neil Methodology. In particular, we believe executing a stop loss on stocks that have broken down from their breakout point is essential to achieving strong returns over time. Unfortunately, with regards to the overall stock market, the recent trend towards breakouts failing suggests that equities have not yet received the “all clear” signal. As a result, investors should remain cautious until the overall technical picture improves.
Kenley Scott, Director, Global Sector Strategist at William O’Neil + Company, an affiliate of O’Neil Global Advisors, made significant contributions to the data compilation, analysis, and writing for this article.
Disclosures:
No part of the authors’ compensation was, is, or will be directly or indirectly related to the specific recommendations or views expressed herein. O’Neil Global Advisors, its affiliates, and/or their respective officers, directors, or employees may have interests, or long or short positions, and may at any time make purchases or sales as a principal or agent of the securities referred to herein.
O’Neil Global Advisors, Inc. (OGA) is an SEC Registered Investment Advisor. Information relating to investments in entities managed by OGA is not available to the general public. Under no circumstances should any information presented in this report be construed as an offer to sell, or solicitation of any offer to purchase, any securities or other investments. No information contained herein constitutes a recommendation to buy or sell investment instruments or other assets, nor to effect any transaction, or to conclude any legal act of any kind whatsoever in any jurisdiction in which such offer or recommendation would be unlawful. The past performance of any investment strategy discussed in this report should not be viewed as an indication or guarantee of future performance. Nothing contained herein constitutes financial, legal, tax or other advice, nor should any investment or any other decision(s) be made solely on the information set out herein. © 2023, O’Neil Global Advisors Inc. All Rights Reserved. No part of this material may be copied or duplicated in any form by any means or redistributed without the prior written consent of OGA.
Read the full article here